After performing jumps, head to the Perch web app to dive deep on the data!
Perch Evaluate offers a few ways to analyze and internalize data. One way is live on the floor when the athletes are receiving immediate feedback, and the other is on the web app after the jumps are completed. Looking at the data longitudinally will enable long term assessment of athlete performance over time. This will also enable tracking how they compare to themselves and others historically.
To access your Assessment data on the web, navigate to the Perch web app and head to the Insights page for a team view, or Athlete Profile page for a specific athlete.
Insights
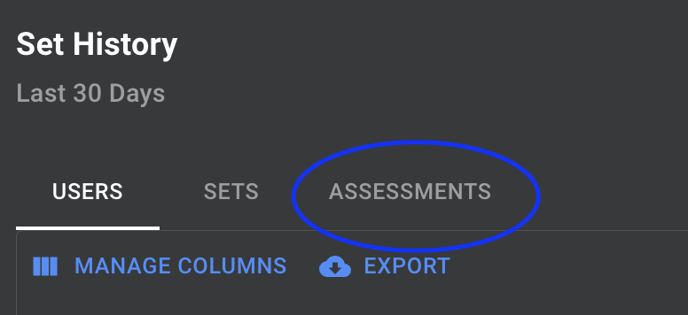
On the Insights page, you'll find the Assessment data on the Set History table at the bottom of the page. Once there, select the Assessments tab.
Here, you'll be able to see the data for the three jumps available in the assessments (CMJ (Arms Fixed), CMJ (Arms Swing), Continuous Jumps) and look at the four metrics available to you - Jump Height, RSImod, Time to Takeoff, and Takeoff Velocity. Keep in mind that these will be based on software tier, so if you can't see them and would like to, please reach out to your Perch representative.
You'll be able to look at the data in three different ways - Last Set, Percent Change, and Standard Deviation. This will show you either the raw data from the athlete's most recent set, the percent change up or down from the value over the selected time frame for that set, or the difference in standard deviation above or below the mean for the selected time from for that set. If the standard deviation or percent change is positive, the number will highlight green. If it's negative, it will highlight red.
-gif.gif?width=600&height=247&name=ezgif-com-video-to-gif%20(12)-gif.gif)
This view will allow you to look at multiple athletes at once and quickly analyze how different members of the organization are doing. If you see something that makes you want to drill down, head over to that athlete's profile.
Athlete Profile
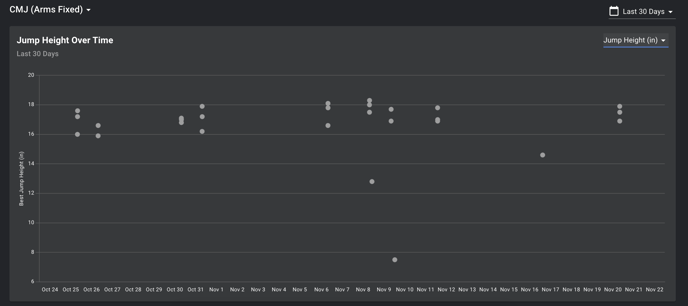
Once you get onto the athlete's page individually and select the Assessments tab, you can change the assessment you'd like to look at or the time frame through the filters at the top of the page. You will see two charts available for you: one scatter plot and one table. On the scatter plot, each dot represents one set. To change the metric, select the drop down in the top right hand corner of the page.
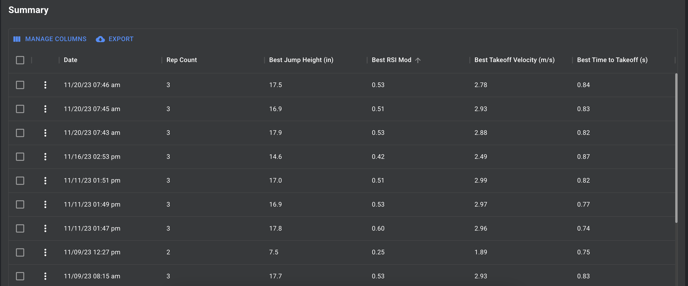
In the table on the bottom, you will see the Set History for each set of jumps, similarly to how you'd see it on the Insights page, but instead of being aggregated by user, you will be able to see one line for each individual set.
If you have further questions on analyzing the assessments, or can't see things that you would like to or feel you should be able to, please reach out to your Perch representative, or email our support team at support@perch.fit!