Tracking Your Assessments on Perch: Perch can be used for many things on the weight room floor, including assessing athletes at the weight rack!
Perch Evaluate is a new product designed to assist you in understanding athlete performance, both on and off of the weight room floor. Our Perch Evaluate assessment tool is accessible on the Perch tablet app.
What are Assessments?
Assessments are a way to get feedback on the state of the athlete. Generally, how the athlete’s nervous system is responding to training. Assessing athletes prior to the training session for the day is critical in understanding if a session needs to be adjusted to optimize training for the individual on a daily basis. Assessment of athlete’s readiness over time will allow you to:
- Track training impact
- Track injury progression / return to play
- Prevent injury / overtraining
- Demonstrate proof of training impact i.e. if a program is having the intended outcomes and adaptations (is my athlete getting faster, more explosive, jumping higher etc).
What type of Assessments can I track, and what can I track off of them?
Currently we offer three jump assessments:
- Countermovement Jump (Arms Fixed)
- Countermovement Jump (Arms Swing)
- Continuous Jumps
For all three of these assessments, you may have access to five metrics, depending on your software tier:
- Jump height
- RSI Mod
- Time to Takeoff
- Takeoff Velocity
- Rep Count
To learn more about how these metrics are calculated, please take a look at our metrics page!
If there are other jumps or assessments that you consistently track, or other metrics that you're interested in seeing, please let us know by contacting your Perch rep or by emailing support at support@perch.fit.
How do I use Assessments?
**NOTE: You must be on camera software version 2.20.0 or higher and tablet app 1.45.0 or higher in order to access this feature properly. If you're having a hard time with any updates of either the camera or tablet app, please reach out to us right away.
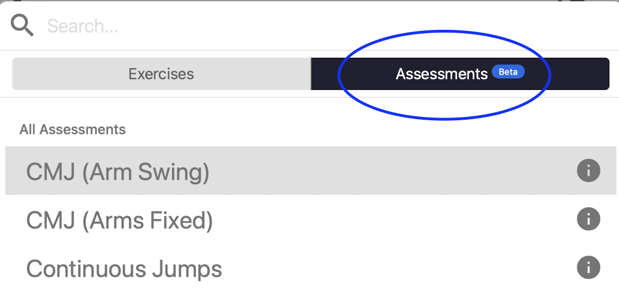
To access Assessments, open your Perch app and go into the Exercise Select menu, just as you normally would, and select the tab in the top right labeled Assessments. Once selected, you should see the exercise selection menu change from your normal exercises to the jumps listed above.
Once you select the exercise, the camera should snap into place just like it would any exercise. We would recommend testing the camera's presets before jumping, just like you would with any other exercise. Keep in mind, the further back you get from the camera, the more of the cone that represents the field of view you'll have to work with. We recommend that you have your athletes stand roughly 7 to 12 feet away from the camera, assuming it's safe for the athletes to do so.
When setting your presets, make sure that you test both the bottom of the field of view as well as the top to ensure that your athletes aren't dipping below the bottom as they gather for their jump, or going out of the top at their peak.
To record a set, simply press the RECORD button at the bottom of the page. The rep recording will look slightly different than it does normally - instead of a bar for each rep, it will display a circle that shows the value of each recorded rep. As you jump, you will see the Rep Count increase in the top left hand corner of the screen to reflect the number of jumps performed. To save your set, hit the Stop button at the bottom of the page, and you'll return back to the tile screen as you normally would.
Once the set is saved, you can look at the Set Summary page to get an idea of how that set compares to your historical data - there's plenty of information for you on this page:
- Overview stats: Quickly compare results from today’s set to recent sets and the athlete’s 30-day average
- Stop-light feature: Perch will highlight when an athlete is performing outside of their normal range!
- Green = Above 1 standard deviation
- Yellow = -1 to -2 standard deviations
- Red = Below -2 standard deviations
- Stop-light feature: Perch will highlight when an athlete is performing outside of their normal range!
- Chart
- The “blue zone” charting function allows you to quickly assess whether assessment sets are within 1 standard deviation from the mean over a selected window of time.
- A dotted line shows the set average for the time period selected.
- Stat comparison table:
- Stoplight feature based on standard deviation.
You also have access to more data analysis via the Exercise Detail tab!
- Overview stats: Quickly compare an athlete’s most recent set to their best and average.
- Filter by 7 days, 30 days, last 3 months or last year to view an athlete’s progression over time.
- Filter by set average or best rep.
- Based on your tier, you can also filter by additional metrics, including modRSI, takeoff velocity and time to takeoff. If you can't see the additional metrics and would like to, please contract your Perch representative.
- View an athlete’s “Trend” stat to determine how their results have been changing during the selected time period.
- Perch’s trend calculating measures the linear fit of an athlete’s set averages over the selected time period and compares how the slope of an athlete’s set average results is changing within the period of time selected.
- Overview Chart:
- The “blue zone” charting function allows you to quickly assess whether assessment sets are within 1 standard deviation from the mean over a selected window of time.
- A dotted line shows the set average for the time period selected.
- Set history:
- View and sort set results to view how metrics are changing over time.
- Navigate to the set’s summary page to view more information about a specific result.